How do I create a report chart from a SELECT SQL statement?

Comments
-
Thank you for using the Forums!
First you need to create a Query Integration with the SELECT SQL statement for the database structure. Here is a screenshot of a SELECT * statement for a database structure I created in my local.
Query Integration Screenshot

Next, once you create the Query Integration, create a Report and add the SQL query as a Data Source
Report Screenshot
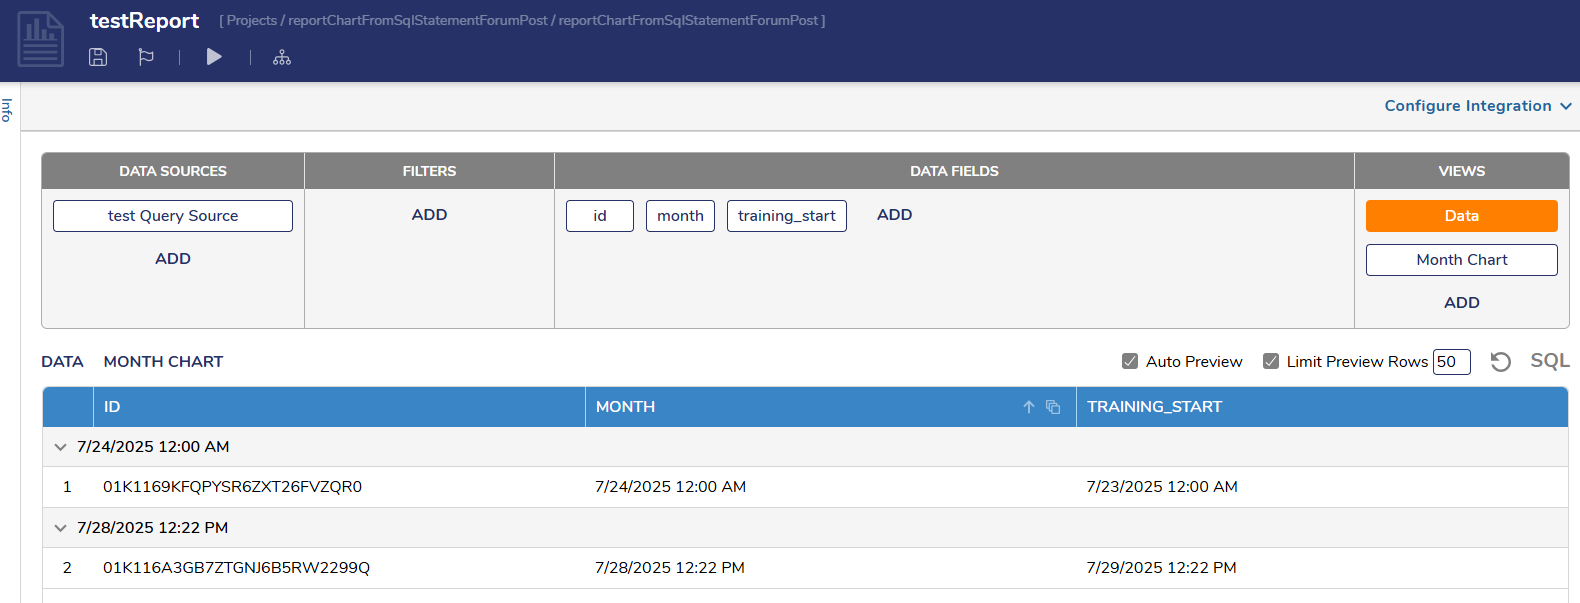
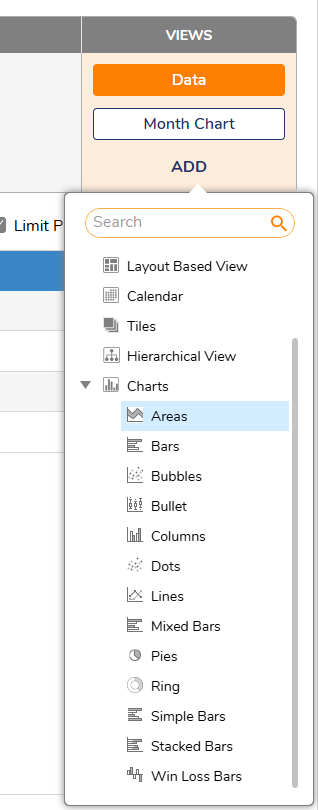
After that, add the fields you want to include and then group the fields you want to group for the chart. Next, click "Add" under the Views tab on the report and select the type of graph you would like.
Chart screenshot
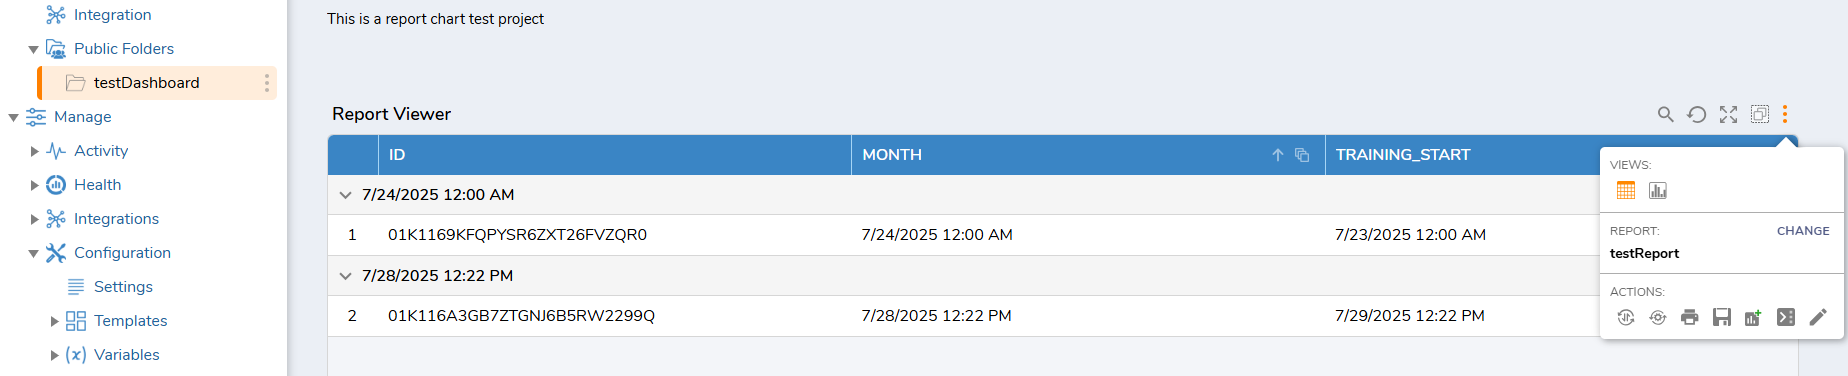
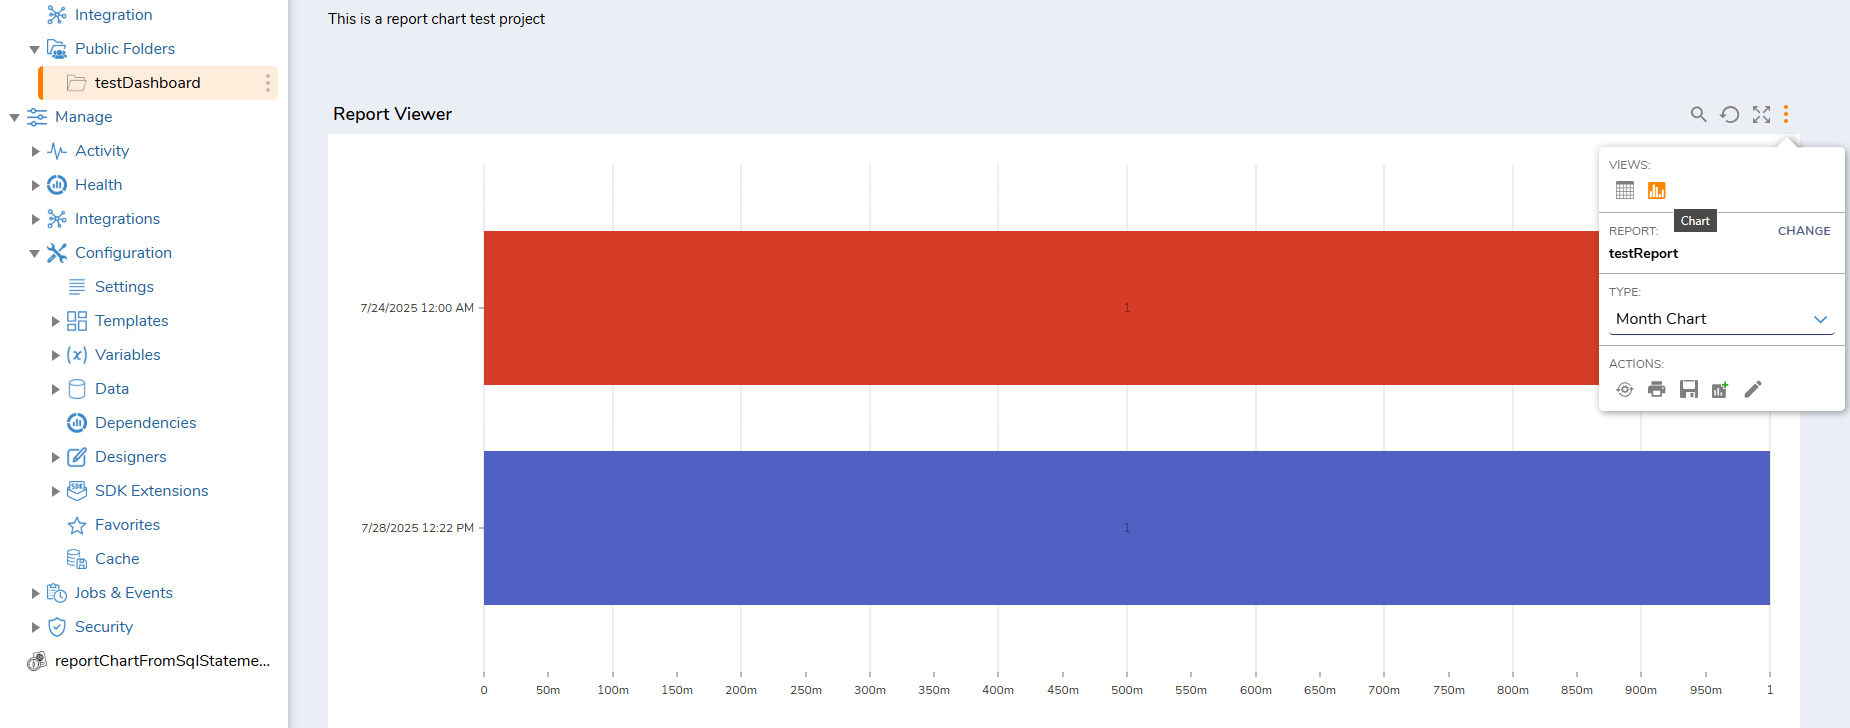
Now, create a Page and use the "Report Viewer" control on the page and add that page to a Dashboard. Once you added the Page to the dashboard you can change the view from the three dots in the corner of the Report.
Report on Dashboard Screenshot and Chart View on Dashboard
Thank you again for using the Forum!
0

Howdy, Stranger!