How do I create a multi-series line graph showing values over time?

Comments
-
First, please check out our documentation on Multi Series charts: Multi Series Charts
What's important to remember when trying to set the date as the x-axis is that the x-axis field is the field that you group by on the report! In the following example, I will be grouping on field 1, which will be considered the date field.
To follow along with this example, please import the following project:
After importing, run the Generate Data Flow (only one time). From there, open the report. You should see three fields per item -- the date field, field3, and field3. Group by the date field, which will be the x-axis. Then, expand the results category and add a new subtotal:
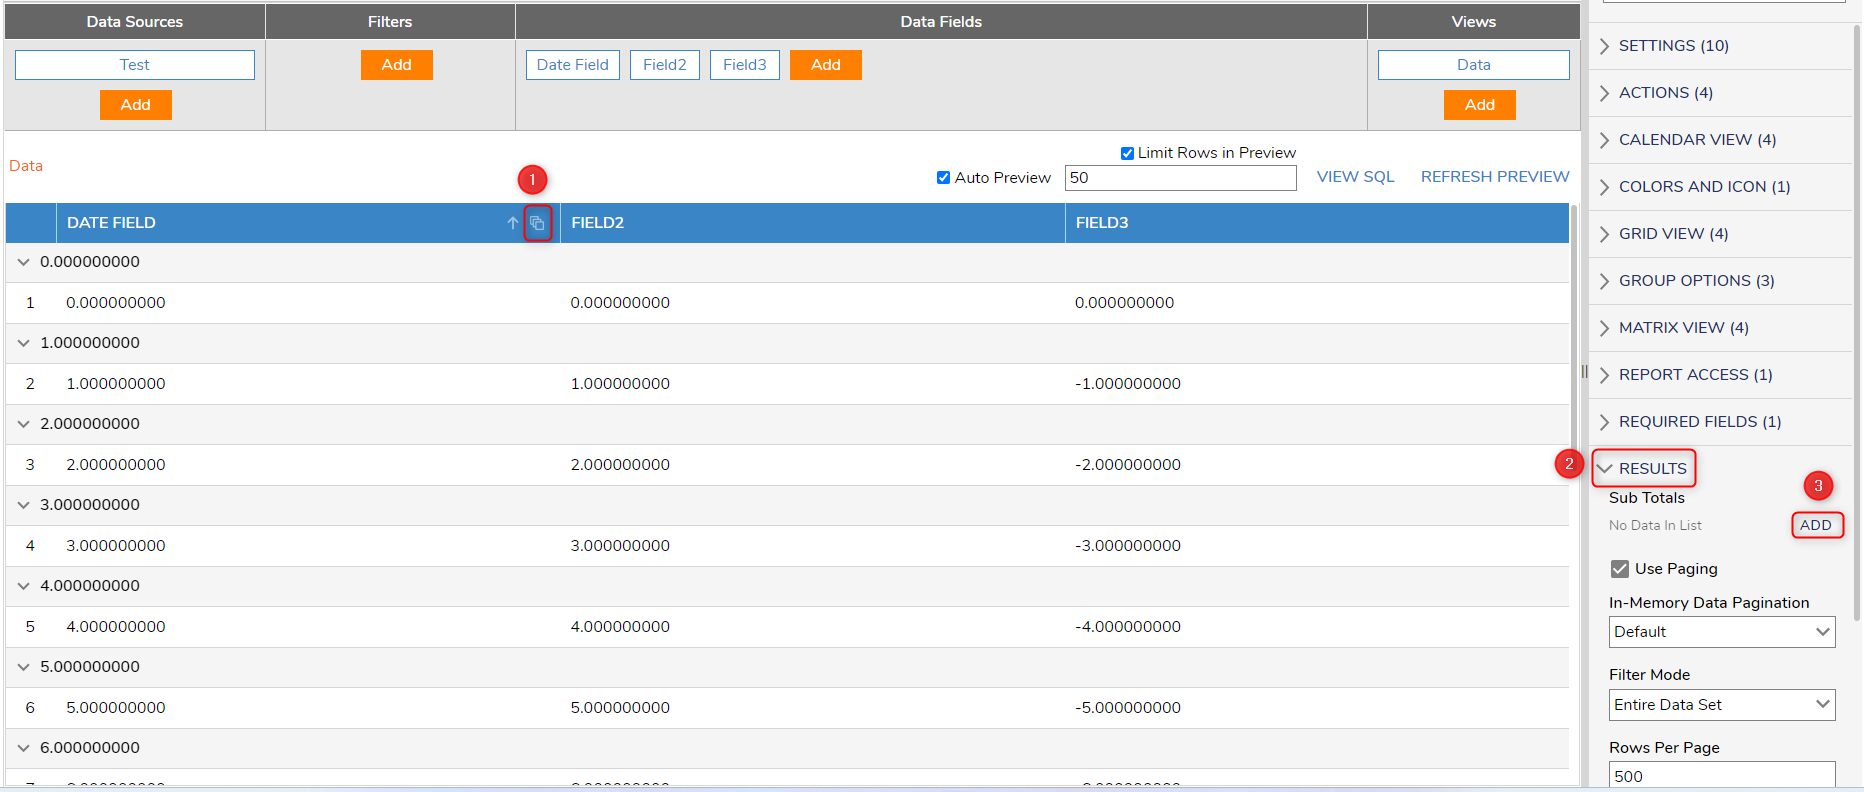
We'll need to add 2 subtotals, one for field2, and one for field3 to show two different lines on the graph. Since there is only one item in each group (one data point for each date per series), you can set the aggregation type to either sum, average, minimum, maximum, or median, as they will be the same value with only one value.

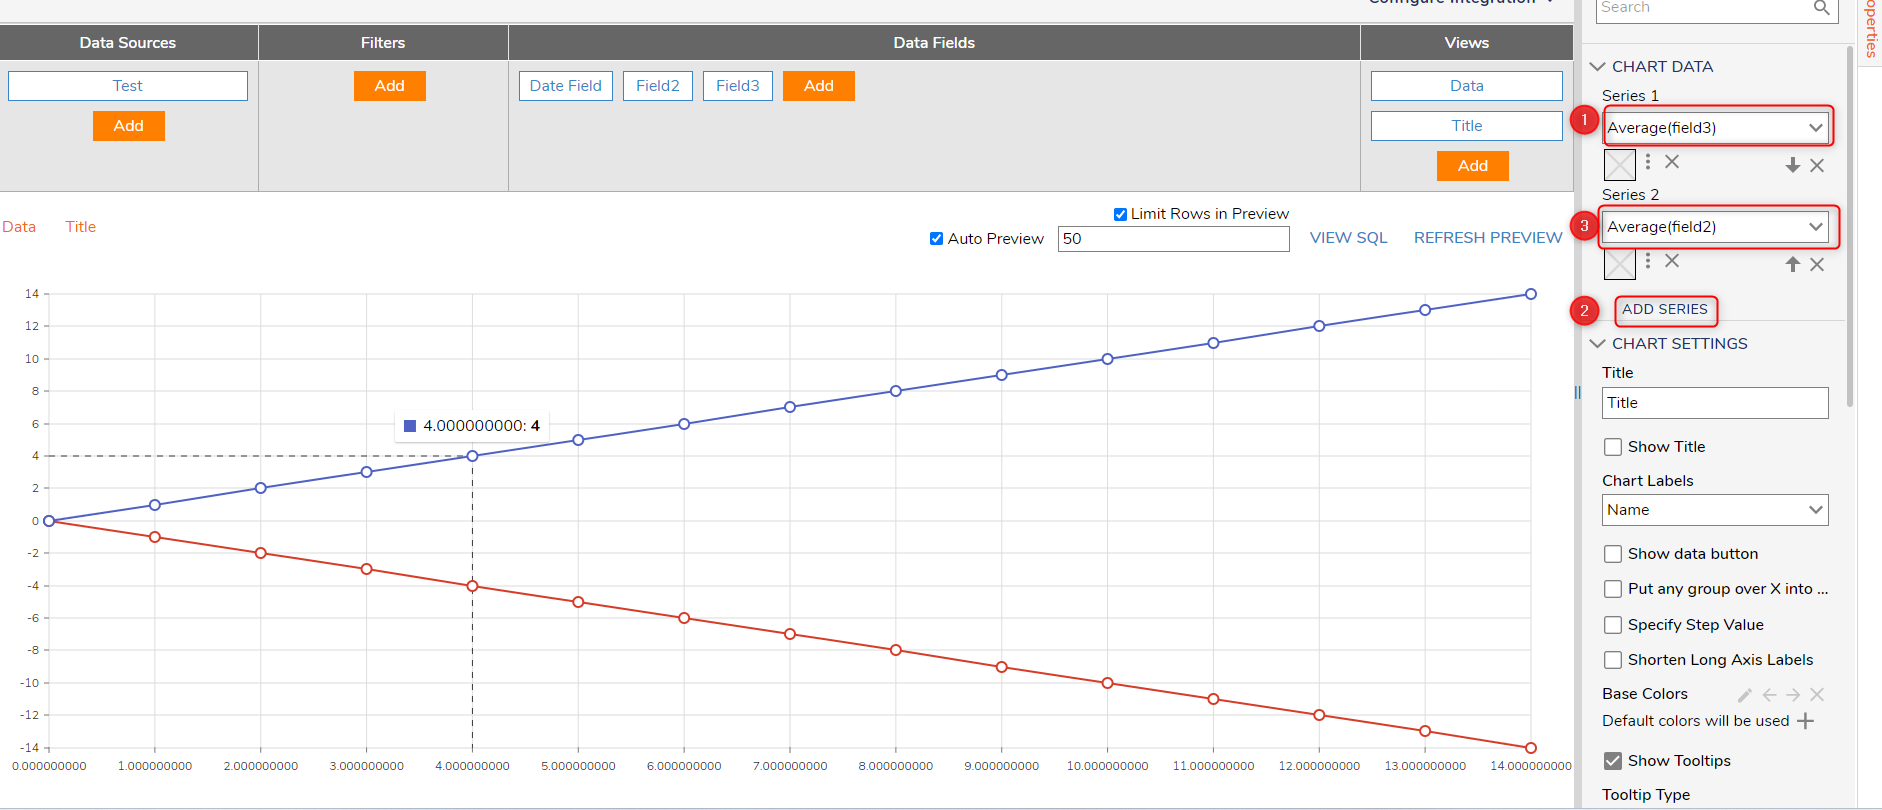
Now, create a line graph as usual, then in the chart data properties, change the first series to one of the series you just created. Then, add a series and select the other series. You should now see the line graph as displayed below.
 0
0 -
If there are no records with a given date then the X axis will hop over the date (as it is not a defined datatype). So If we wanted to plot for ALL dates, including when there is no data for that date (i.e. go to zero in this example perhaps), how could this be achieved?
A better example in this case might be number of records created on each date. The dates where there are NO records with a creation date matching will generate no chart data, but the chart will not put in the missing date with a zero value. Is there an easy way to include these dates?
0 -
Hello Haim,
You will probably need to convert Null counts to 0. Putting these records into a defined datatype should allow for days with no records created to be recorded as 0, and thus mapped correctly to the graph above.
So, you would create the date in the datatype that has no records created on it, and map 0 to a number field in that datatype.
We hope this helps!
-Gregory
0


Howdy, Stranger!