Semicircle Graphs

Comments
-
Hi Jaycee,
Thanks for using Decisions and reaching out via the Decisions Forum. There is a semicircle diagram tile page control that you can use. Follow the steps in our Diagram Tiles documentation while making the following adjustments at step 4: instead of selecting Annotation select Charts > Semi Circle, drag the semicircle to the grid. With the semicircle still selected, in the properties panel set the Upper Limit value input (the max possible value) and the Value input (select the given input from flow data) > details for editing the look and adding a label in step 4 and 5 can be followed if desired > move to step 6 and proceed with the rest of the steps outlined in the doc.
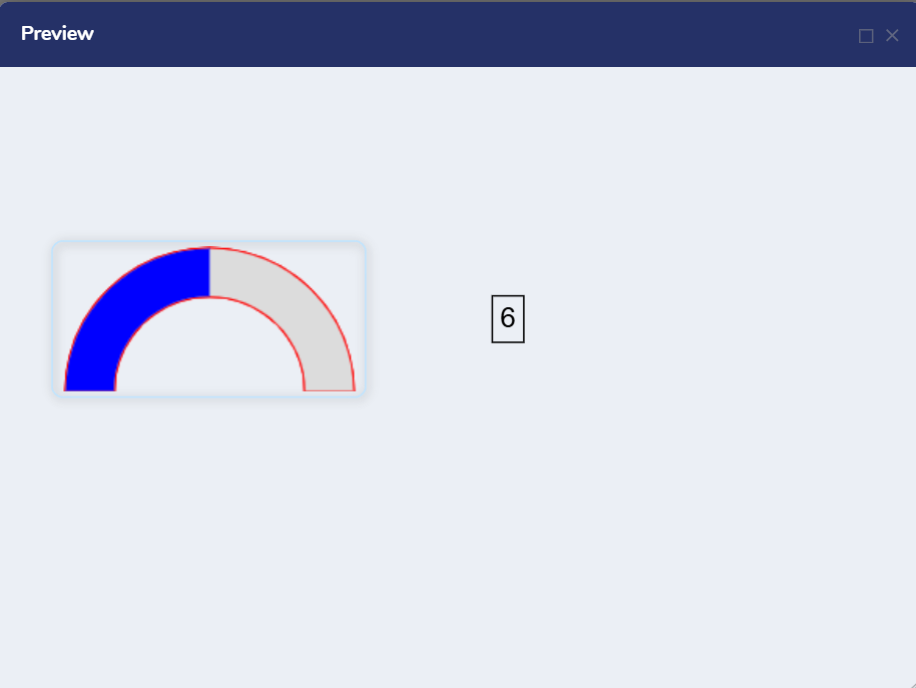
Here's a preview of a configured graph with a label that shows the value of the graph.
I hope this helps!
Tawanda | Decisions Support
0

Howdy, Stranger!