Adding Ad Hoc Charts to a Report at Runtime

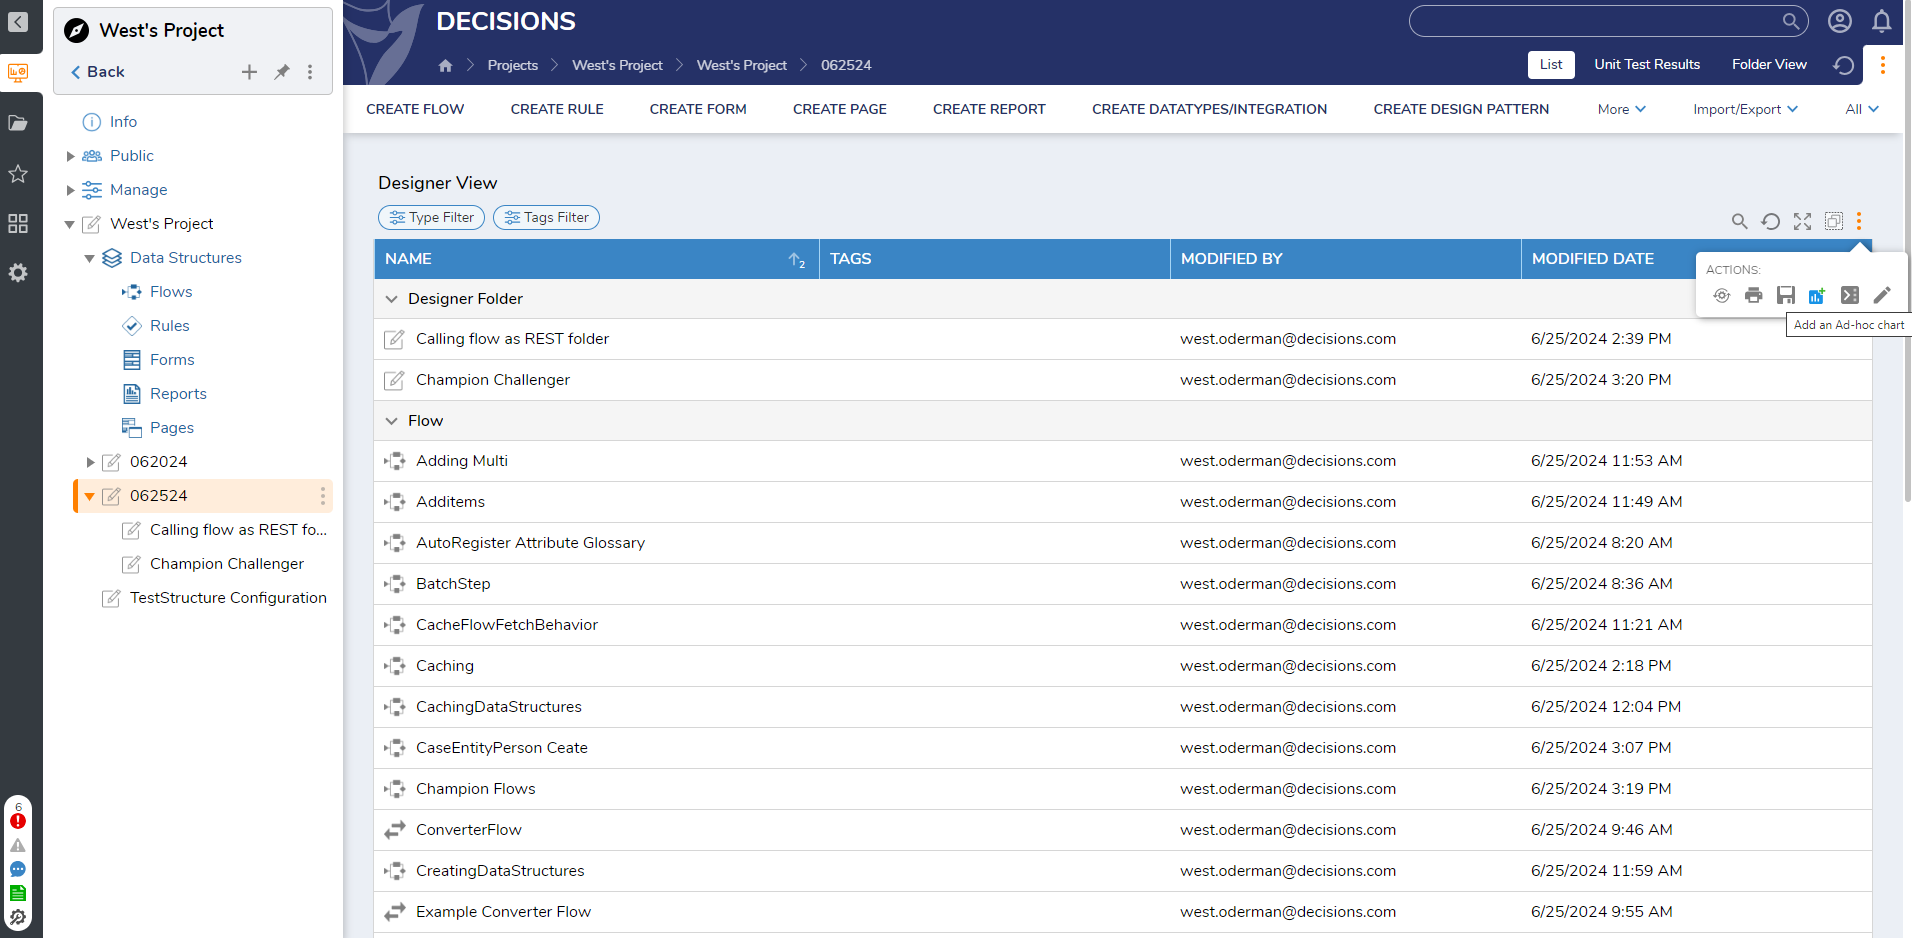
1 On an existing Page, select the Report Viewers Settings icon. Under Actions, select the Add an Ad-hoc chart icon.
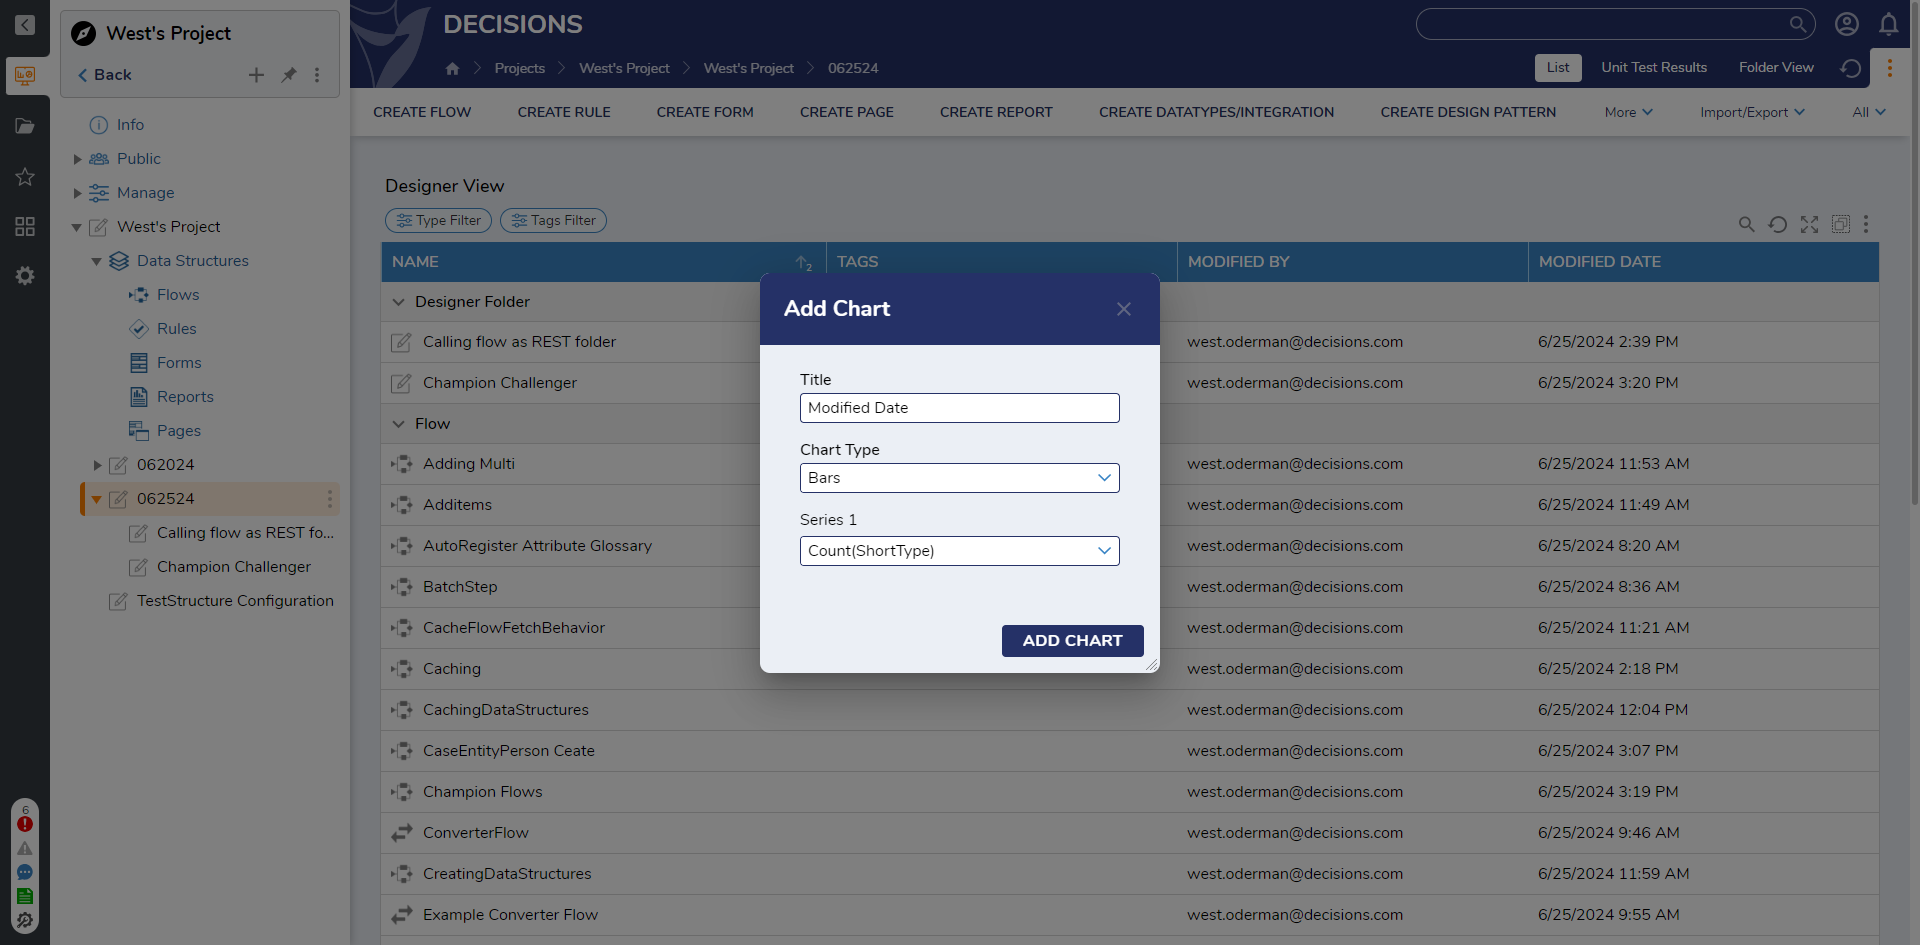
2 In the Add Chart dialog, select the Chart Type and give the Chart a Title. If multiple groupings exist on the Report, pick the specified grouping in the Field drop-down.
3 Select ADD CHART.
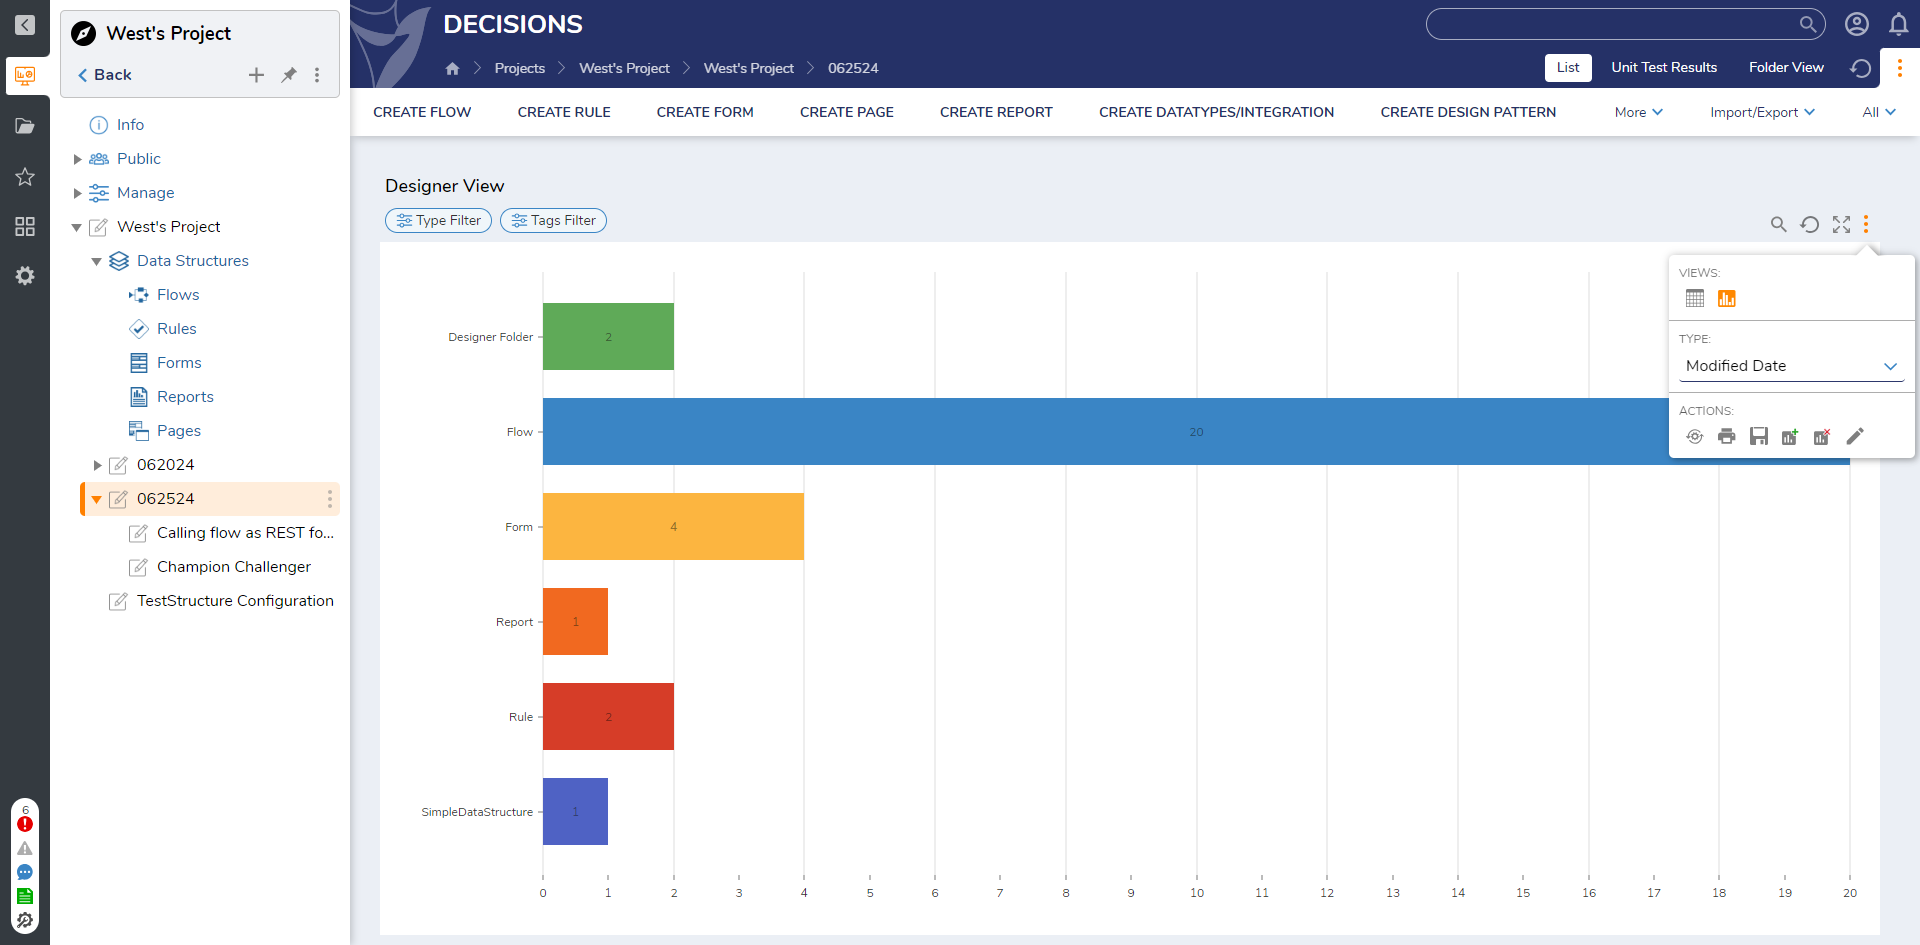
4 The ad-hoc chart will appear under Views. To remove the ad-hoc chart, click the Remove Ad-hoc Chart button.
from: https://documentation.decisions.com/v9/docs/adding-ad-hoc-charts-to-a-report-at-runtime-2
0