Filter All Charts And Graphs Within A Report
![[Deleted User]](https://w4.vanillicon.com/v2/405e65ccf7b995f883e9718428cf100b.svg)
I have a dashboard that contains multiple charts and graphs. Is there a way to filter all of them with just a single filter?
Comments
-
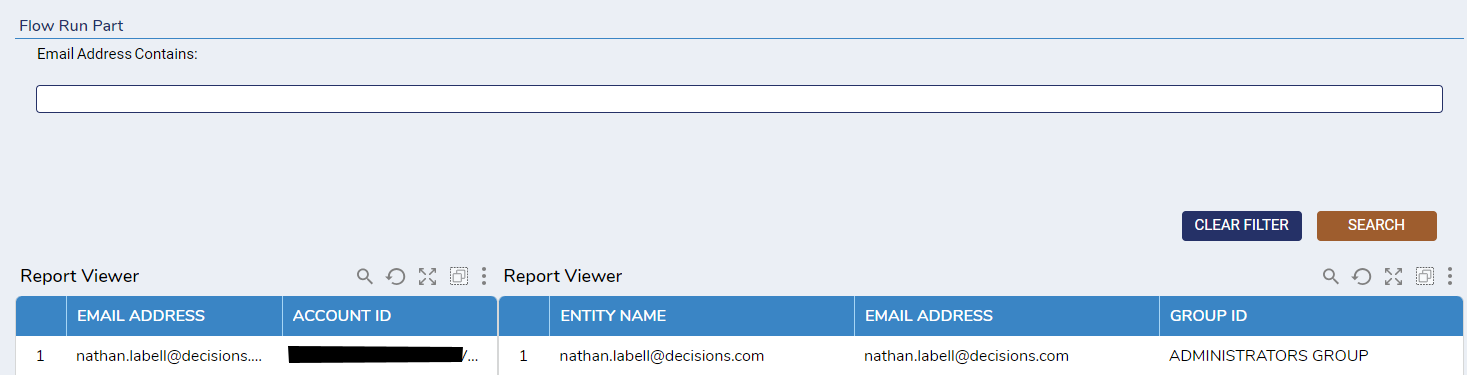
This can be achieved using a Flow Run Part. The attached project contains two reports within a dashboard that are filtered via the string inputted in the Email Address Contains textbox.
Flow Run Part Documentation: https://documentation.decisions.com/docs/flow-run-part
Filtering Reports via Page Control Documentation: https://documentation.decisions.com/docs/filtering-reports-via-page-controls
Please Note: The examples attached were developed to be instructional, and were not developed as officially supported components. For more information or to engage our service team to develop fully supported, production quality solutions, please contact: services@decisions.com.
0
![[Deleted User]](https://wa.vanillicon.com/v2/afc3a198b6337c4c433ae70b6b323525.svg)
Howdy, Stranger!