Questions about Pages and Bar Chart

- Can we display only the top 10 categories of the report on the page, and if so, how?
- Can we have a button on the page that displays all the categories without a limit?
- Can we fix the size of the bars in the bar chart? If the chart size increases, can we add a scroll bar without reducing the bar size?
Comments
-
The details/answers are as follows:
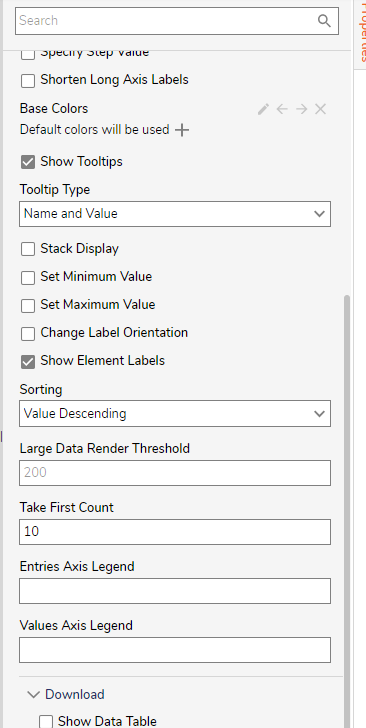
1. On changing a few properties of the report this can be done. Group the report based on the values you need to sort. In properties set "Sorting" to " Value Descending" and "Take First Count" to 10. This will display only the top 10 categories.
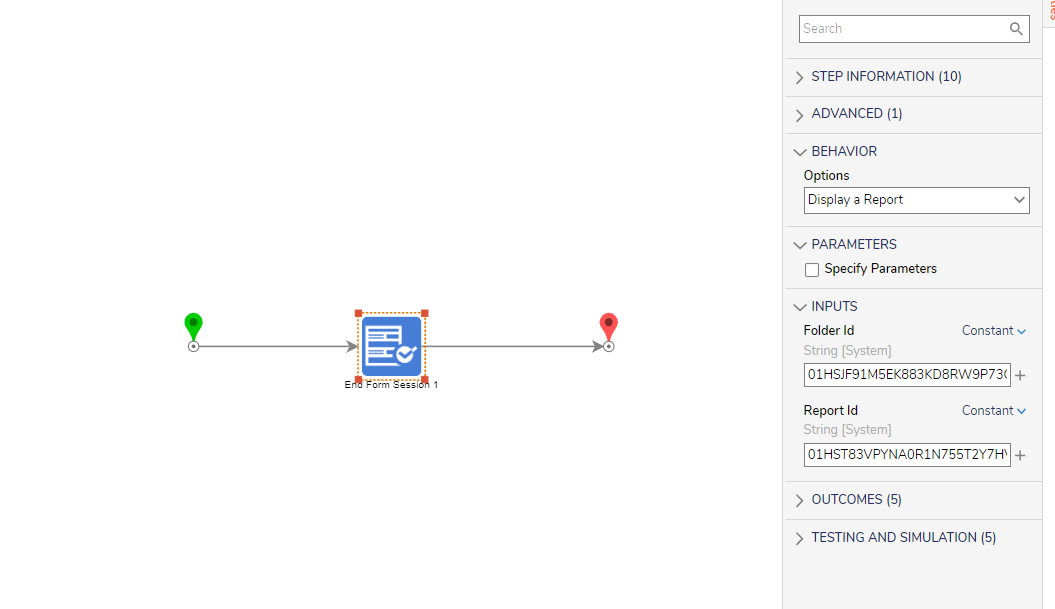
2. Create a separate report you desire to display by clicking the button. Add a run flow button on the page. Create a page with "End Form Session". Set the properties of "End Form Session" as shown in the image. Folder ID is the ID of the folder where the report is saved. Report ID is the ID of the report you wish to display. You can change the button to a link /image as well. On double-clicking this on-page will display the report in a pop-up window.
3. Decisions automatically re-size the report to display all the bar categories. Can't define the size of the bar.
0

Howdy, Stranger!